
I recently had this idea to simulate the famous Monty Hall Problem (also known as the 3 Doors Game) to see if reality matches the mathematical explanation. Here’s what I found.
Rules of the Game:
Let’s recap the setup of this intriguing brain teaser:
- There are three identical doors. Behind one of them is a brand-new car (the grand prize), while the other two hide goats (no prize).
- As the contestant, you pick one of the doors, guessing which one hides the car. For example, let’s say you choose Door 1.
- After you make your choice, the host—who knows what’s behind each door—opens one of the two remaining doors, always revealing a goat.
- Now, with two doors left (your chosen door and another unopened door), the host asks: “Do you want to stick with your original choice or switch to the other door?”
The goal is simple: maximize your chances of winning the car.
Stick or Switch?
At first, I thought whether to switch or stick had an equal chance of winning: 1 out of 3. But math tells a different story.
Let’s break it down:
- If you stick, your chances of winning are based on your initial choice, which had a 1/3 probability of being correct (one correct door out of three).
- If you switch, here’s what happens:
- The door you initially chose had a 1/3 chance of hiding the car.
- This means the other two doors collectively had a 2/3 chance of hiding the car.
- When the host reveals a goat, the full 2/3 probability is transferred to the remaining unopened door.
This makes switching the better strategy because it increases your chances of winning from 1/3 to 2/3.
Why Does It Feel Counterintuitive?
At first glance, it might seem like after the host reveals a goat, the two remaining doors should each have an equal chance (1/2). But that’s not true because your initial choice locked in the probabilities.
- The door you picked still has a 1/3 chance.
- The unchosen, unopened door inherits the full 2/3 probability after the host eliminates one option.
Simulating the Monty Hall Problem
To test this concept, I wrote a simple simulation to play the game thousands of times. The goal was to measure the actual winning probabilities for both strategies—stick and switch—over a large number of rounds.
The Results:
Here’s a chart showing how the probabilities behave as the number of games increases:
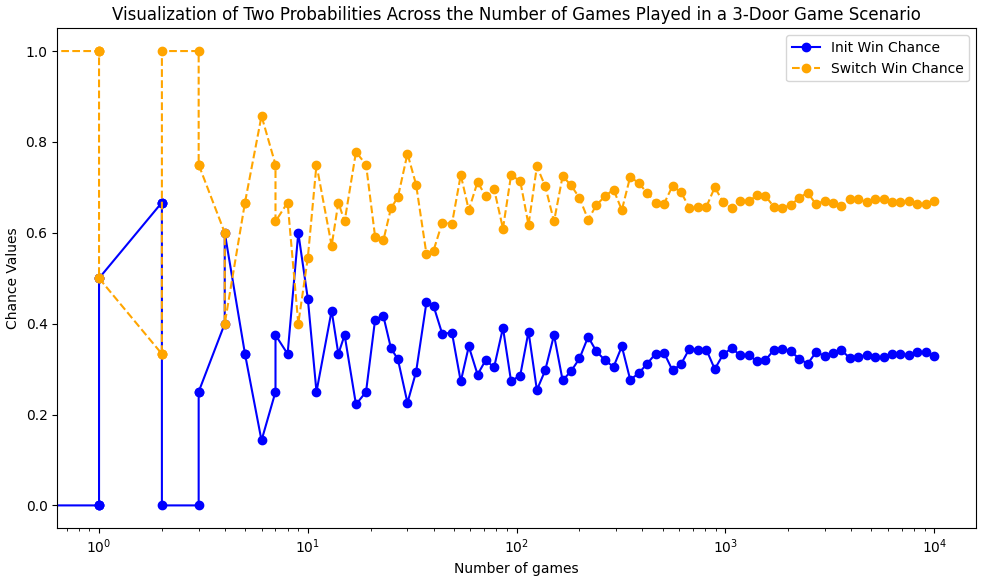

- The x-axis represents the number of games played (from 1 to 10,000).
- The y-axis represents the winning probability (0.0 to 1.0).
- The blue line shows the probability of winning if you stick with your original choice.
- The orange line shows the probability of winning if you switch.
How to Read the Chart:
- With fewer games (left side of the chart): The probabilities vary wildly because outcomes are dominated by luck in the short term.
- As the number of games increases (right side of the chart): The probabilities stabilize, revealing a clear pattern:
- Sticking hovers around 1/3 (blue line).
- Switching stabilizes around 2/3 (orange line).
Conclusion:
If you’re playing the Monty Hall game once, the result might seem like pure luck. But if you get to play multiple times, trust the math—switching doors consistently gives you a better chance of winning the car. The simulation clearly demonstrates that 2/3 > 1/3 when it comes to maximizing your odds.
Give it a try yourself and see if you can trust your intuition—or if the math wins out in the end!
Leave a Reply